sandroid.dev
sandroid.dev

Paper Stained Glass Lampshades

Background

This project was inspired by my visit to the Sagrada Familia in Barcelona, and to the other Gaudi-designed buildings in the city. There was a lot of mosaic about, and I particularly liked the colours and stained glass within the church.

I had also just recently moved into my new flat, and wasn’t a fan of the existing, beige lampshades. They needed to be changed to something more fun asap. I was so inspired, in fact, that I started this project the moment I got back from the trip.

Getting started

Ideally these lampshades would be made of mosaic glass, but not having done any of that before, and not having the materials or tools for it, I started with paper (and clear film). The lampshades are a conical shape, with a circular base and top.

I’ve got an A4 colour printer so that was to be the maximum size of paper I could use, and thankfully A4 was just large enough to wrap around the lampshade so it could be done in one piece.

I found this handy tool to generate a template for the shape it should be: Template Maker

The Images

I wanted the lampshades to evoke the feeling of stained glass, so I needed something to print that looked roughly like it. I had a go at searching Google for suitable images, but nothing struck my fancy.

Thankfully, we live in an age where we have chopped up all art in existence and fed it to the machines, so I was able to ask them to create me some stained-glass-looking images with the colour palettes that I wanted, and they did an admirable job. I don’t remember which image generator I used.

The Lampshades

There’s already some photos at the top, but here they are again:

The Very Dark One

As an experiment I thought what if I created one that is mostly opaque, and only has a small part which lets out light.

The results were underwhelming.

There’s a lot of light that comes out from the top and bottom of the shade, which are open, which diminishes the effect I was going for. Also, the blackness of the page even with fully black ink wasn’t enough to fully block the light from behind, so the light image doesn’t actually pop as much as I had imagined.

Improvements

  • The generated images are rectangular, while the shape of the lampshade is curved. This means the photo doesn’t neatly wrap around, which would be problematic if you wanted something to flow along the edge or point vertically upward etc. This could be solved by warping the image, I guess, or generating an image along the constraints perhaps. But for the abstract images I was using it was not that noticeable so I didn’t bother with anything other than rotating the image to the most appropriate direction.
  • The ink came out very faint on the see-through film. Maybe if I increased saturation and dropped the brightness before printing it would look more striking?
  • Would be nice to add some finishing touches like doing up the edges somehow so everything looks a bit neater.

Rotating Shimmer Hat

Speed: 0.4x

I’ve been thinking about shimmery and glittery things and how to capture them. The ideal would be to create a lenticular print of a reflective object / scene, like catching the reflections of snow for example.

This is an attempt at capturing a rotating crystal-covered hat as a series of photos and using photoshop to align the layers, and to create the animation. The first attempt was way too fast, so initially I created 3 different versions with ffmpeg at different speeds to see which one worked best.

But I then realized I could just use javascript to control the playback speed, which would save bandwidth and allow for more flexibility.

Different version

Versions

Original (1.0x)

100% Slower (0.5x)

Speed: 0.5x

200% Slower (0.33x)

Speed: 0.33x

300% Slower (0.25x)

Speed: 0.25x

Aphantasia VR Tester

(VR headset required) - VR Aphantasia Tester.

Some people can see images of things that are not there, just by thinking about them. This is not considered a mental illness. For some, this effect only appears when their eyes are closed. For others, they can overlay these images on top of the real world.

Not everyone suffers from this affliction. There are people in the world who can only see what is in front of them.

When you speak to someone who has a different experience of visualization, it can be hard to understand what they mean. One cannot fully grasp what it is like to be inside another person’s mind.

It would be useful to have some sort of empirical test to determine whether someone has this condition. Apparently, there are a couple.

The podcast episode “Aphantasia” by Radiolab describes an experiment where a VR headset is used to show a person two different images for each eye. A green square and a red triangle, for example. Apparently, people who suffer from a lack of aphantasia can force their brain to see ONE image by imagining it strongly enough. E.g. if they think of a green square while using the app, they will only see the green square, and the red triangle will disappear. Aphantasic people will see see both images at the same time, with the red triangle and green square superimposed on each other or flickering between the two.


New: A Grid of Photogrammetry Experiments

Following on from blog/2025-10-15-ply-viewer I’ve added a photogrammetry page to display many of them in a grid.

Next steps / thoughts

  • The grid feels wrong. Since they’re interactive, you generally want to be in fullscreen and spend more time with each. Maybe a carousel or something might work better?
  • You can’t see the image until you click Load. Would be nice to have some baked 2D snapshots to preview before committing to a download.
  • It should show the actual MB size of the capture instead of a hardcoded estimate. (Most are now actually less than 10MB after compression.)
  • Scale, zoom limits, and camera starts are all over the place. I want a tiny debug HUD to dial those in per capture and spit out config.
  • I’ve taken these with Scaniverse, which includes the skyboxes in its own display; the .ply export doesn’t include that. I should figure out how to extract them, or see if switching to .spz would give them to be baked in.

Screenshots for posterity

Screenshots to remember the current state since I’ll probably change the page a lot as I iterate on it.


New page for the little things

Added a new section to the site called zoetropes. A place to collect small experiments and snippets that don’t really categorize well or don’t feel “finished” in any way.


3D PLY Viewer

Interactive 3D viewer for photogrammetry scans. Drag to rotate, scroll to zoom.

These models use the Gaussian Splatting format, which stores 3D points with color information encoded as spherical harmonic coefficients. The PLY file structure includes:

  • Position: x, y, z coordinates for each point
  • Normals: nx, ny, nz (used for other purposes in the original data)
  • Color coefficients: f_dc_0, f_dc_1, f_dc_2 - the DC (zeroth-degree) spherical harmonic coefficients

To extract RGB colors from these coefficients, we use the formula:

SH_C0 = 0.28209479177387814  // 1 / (2 * sqrt(π))
R = 0.5 + SH_C0 * f_dc_0
G = 0.5 + SH_C0 * f_dc_1
B = 0.5 + SH_C0 * f_dc_2

The standard Three.js PLYLoader doesn’t recognize these custom attributes, so the viewer includes a custom parser to extract and convert them to vertex colors.

Update 20/10/2025: Added support for loading compressed .7z PLY files by decompressing them in the browser. Using 7z compressed the living room model from about 100MB to about 10MB!


Moving to DigitalOcean

I’ve migrated the project from github-pages to a DigitalOcean droplet. Amazingly, the whole process took only about 2 hours, whereas I would have expected it to take a whole day or two.

The migration means I have access to a persistent server on the same machine as the frontend! So I’ve added a little API that means you can “like” things on the website. At the time of writing this only includes the little envelopes in the previous blog post, but perhaps sometime in the future that might include other things?


100 Claude Envelopes

Looks like everything I write about is some LLM experiment these days. But it’s fun to mess around with it, I can’t help it.

This time I had a go at using CLI Codex to generate SVGs for me. I wanted an envelope SVG to put on the Contact page, but it couldn’t quite get it right. So I asked for another.

And another.

And another.

And by that point I was bored of the original goal of getting a usable SVG, and just enjoyed seeing the variations. So I asked it to generate a hundred of them, and here they are.

The annoying thing was having to ask it to generate 5 or 10 at a time. If you asked for 20 or more, it would start templating, and it would do things like generate a base one, then just vary the backgrounds, for example. If I asked for a hundred straight up, it would start writing a Python script to generate them.

I think the max you’d want to go for is about 5 at a time. And for best results hiding the results from the previous runs, or it will just keep trying to vary existing designs again.


Trump sings Handlebars (AI cover)

I’ve been reading the news too much lately and it’s scary and confusing. I listened to Flobots - Handlebars and was struck that the lyrics could almost verbatim be a POTUS speech in today’s economy. So I used this and re-wrote the lyrics 120 characters at a time, and then stitched them together in Ableton Live.


2025-09-13 I no longer can tell what is AI

Youtube’s algorithm suggested a video of Aunt Velma - The Canadian Conspiracy Queen to me. I watched it all, thought it was funny and well done, and surprised it only had 10 views or so. I read the description of the channel which said it is AI generated.

When I watch it again there are loads of tells, but I didn’t realise at all while watching it casually at first. The tech has gottten really good.


Using AI to make music with Ableton Live

Link to MCP: https://github.com/ahujasid/ableton-mcp

LLMs can now control software on your computer using MCPs. Someone had made one for Ableton Live, and I wanted to see how the AI would do at creating a simple beat. I gave it a vague instruction to “create the song of the future”, and it took it from there. It figured out which instruments would be appropriate to use, made some loops, and named everything thematically. I think the end result is pretty good!

It’s a surprising use of Copilot in VSCode for me, and imo an interesting way to interact with software.


The Interactive Art Idea Generator

I have lists in 3 categories: Sensors, Output, and Objects. The idea is to randomly select one item from each list and combine them to create an interactive art project. That is all.


Using Source Control for Bash Profile Files

I followed this blog post to add my dotfiles from $HOME to git.

That tutorial creates an alias for a custom git command to use for that directory. I found it ever so slighly annoying that I couldn’t just do git status etc in my $HOME directory, and had to remember another alias for it.

So to fix it, I wrote a wrapper function around the git command to either run the special detached Head command when in $HOME, and regular git anywhere else.

bash

alias dotfiles='git --git-dir ~/repos/dotenv/.git --work-tree=$HOME'

gitOverride() {

		# In home directory, call custom detached head git command
		if [ $PWD = $HOME ]; then
				echo "Running dotfiles git command.."
				command git --git-dir ~/repos/dotenv/.git --work-tree=$HOME "$@"
		else
				echo "running regular git command";
				command git "$@"
		fi
}

alias git=gitOverride;

And that’s it! Works great, and saves just a little bit of brain space.

Quick paraphrasing of the rest of the process for posterity:

  • Create your git directory (where .git will be), somewhere other than $HOME. E.g. $HOME/repos/dotenv
  • Add a .gitignore file that ignores everything
  • Add the above alias to your .bash_aliases or wherever you keep them
  • If you want to add files in $HOME to source control, add them with git add -f [filename]

Plotterbjork

One of the more basic things you can do with a plotter is pointillism. That’s the technique of creating an image out of tiny dots - the same mechanism screens use to display images, the dots being different coloured pixels. By varying the distance between the dots according to the brightness of the underlying image, you can get a low resolution interpretation of it.

It sounds like a fun thing to try, but in the end I was left a little disappointed by my results. The main problem I had with is that the output just looks like the output from a poor inkjet printer, and doesn’t have much of the characteristics of using a plotter in it. Sure, if you look closely you can see the variations in the dots (caused by the pen being at an angle or due to variations in the ink flow), but each dot is small and specific enough that it’s a little boring.

Quickstart

  1. Load up an image, and starting at the top left, get the brightness information for a pixel at (x, y).

    java
    img = loadImage("Bjork_EB.webp");
    int imageW = img.width;
    int imageH = img.height;
    y = (iteration + 1) + int(random(1, 4));
    x = x + step * int(random(1, 3));
    color pix = img.get(x, y);
    float brightness = brightness(pix);
  2. If the brightness is less than a cutoff value, either:

    a. If it’s a very dark pixel, just draw the point, and choose a small step size for the next x coordinate.

    java
    if (brightness < 50) {
      step = round(random(2, 3));
      drawPoint(x, y, delay);
    }

    b. If the pixel is near the middle of the image (bjork’s face), draw the less dark pixels around 50% of the time to get some lighter shadows. Choose a “medium” step value for increasing x.

    java
    else if (x < 0.6*imageW && x > 0.3*imageH) {
      if (random(0, 1) > 0.5) {
        fill(0, 0, 200, 90);
          drawPoint(x, y, delay);
      }
      step = round(random(3, 6));
    }

    c. If the pixels are not in the middle, draw the pixel only 5% of the time, and choose a large step value, so we can skip over empty parts.

    java
     else {
      step = int(random(5, 15));
      if (random(0, 1) > 0.95) {
        fill(0, 0, 200, 90);
        drawPoint(x, y, delay);
      }
     }

  3. Choose a new point on the x-axis depending on the step value, and repeat until the end of the row, and start again from a new y. Repeat until the whole picture is done.

I was hoping that by using somewhat convoluted rules, some characteristics of them would remain visible in the final plot. As in, you would almost be able to almost deduce the rules by looking at the image, or your brain subconsciously could. I don’t think it really worked, as the final image looks nice, but pretty ordinary.

I was surprised how easy it is to work with images in Processing though. I had avoided it until this, but it’s not that bad!

Full code:

java

PImage img;

import processing.serial.*;

Serial myPort;    // Create object from Serial class
Plotter plotter;  // Create a plotter object
int val;          // Data received from the serial port
int lf = 10;      // ASCII linefeed

//Enable plotting?
boolean PLOTTING_ENABLED = true;
boolean draw_box = false;
boolean draw_label = true;
boolean up = true;

boolean just_draw = true;


//Label
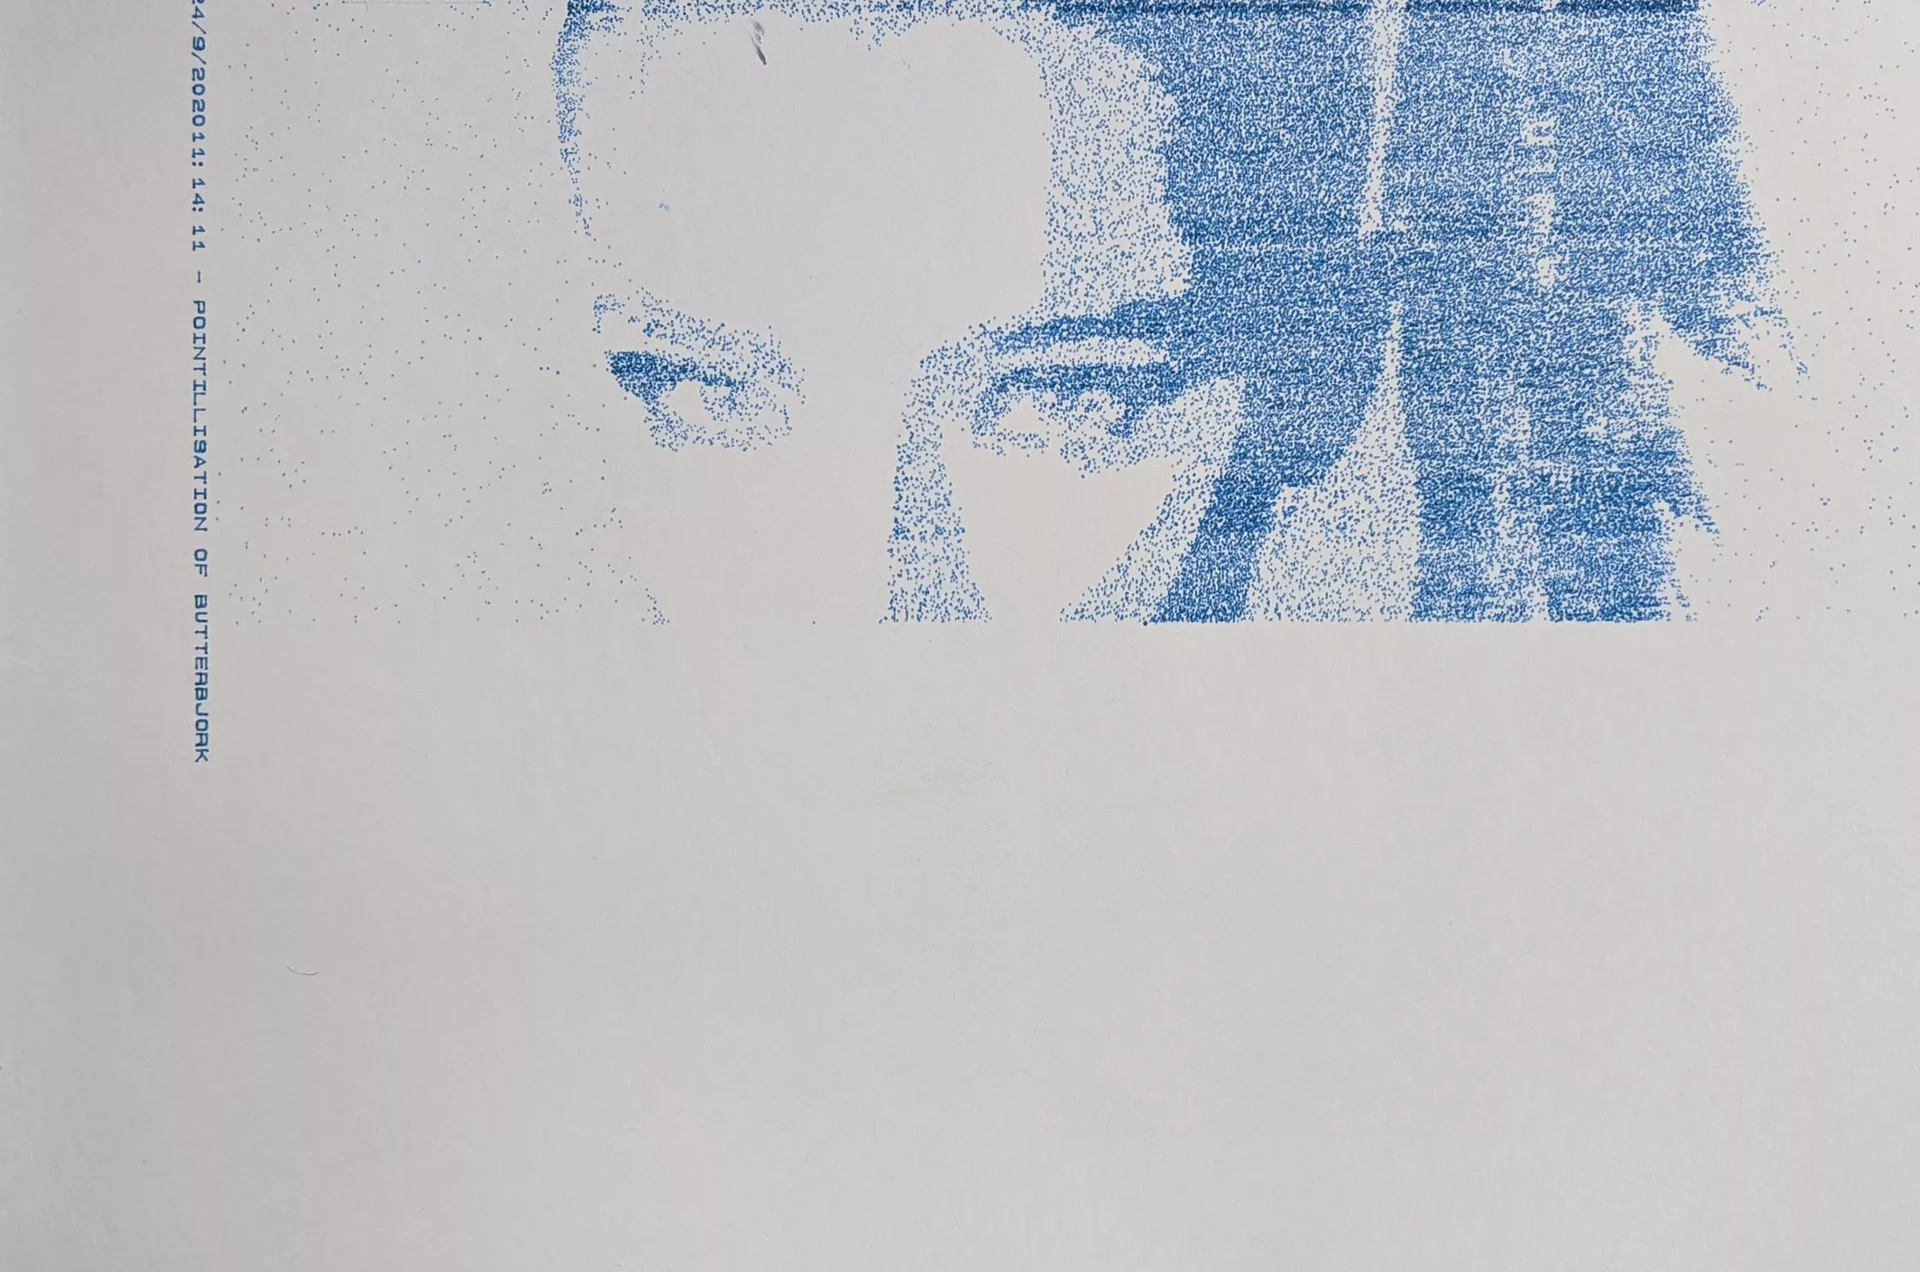
String dateTime = day() + "/" + month() + "/" + year() + hour() + ":" + minute() + ":" + second() + " - ";
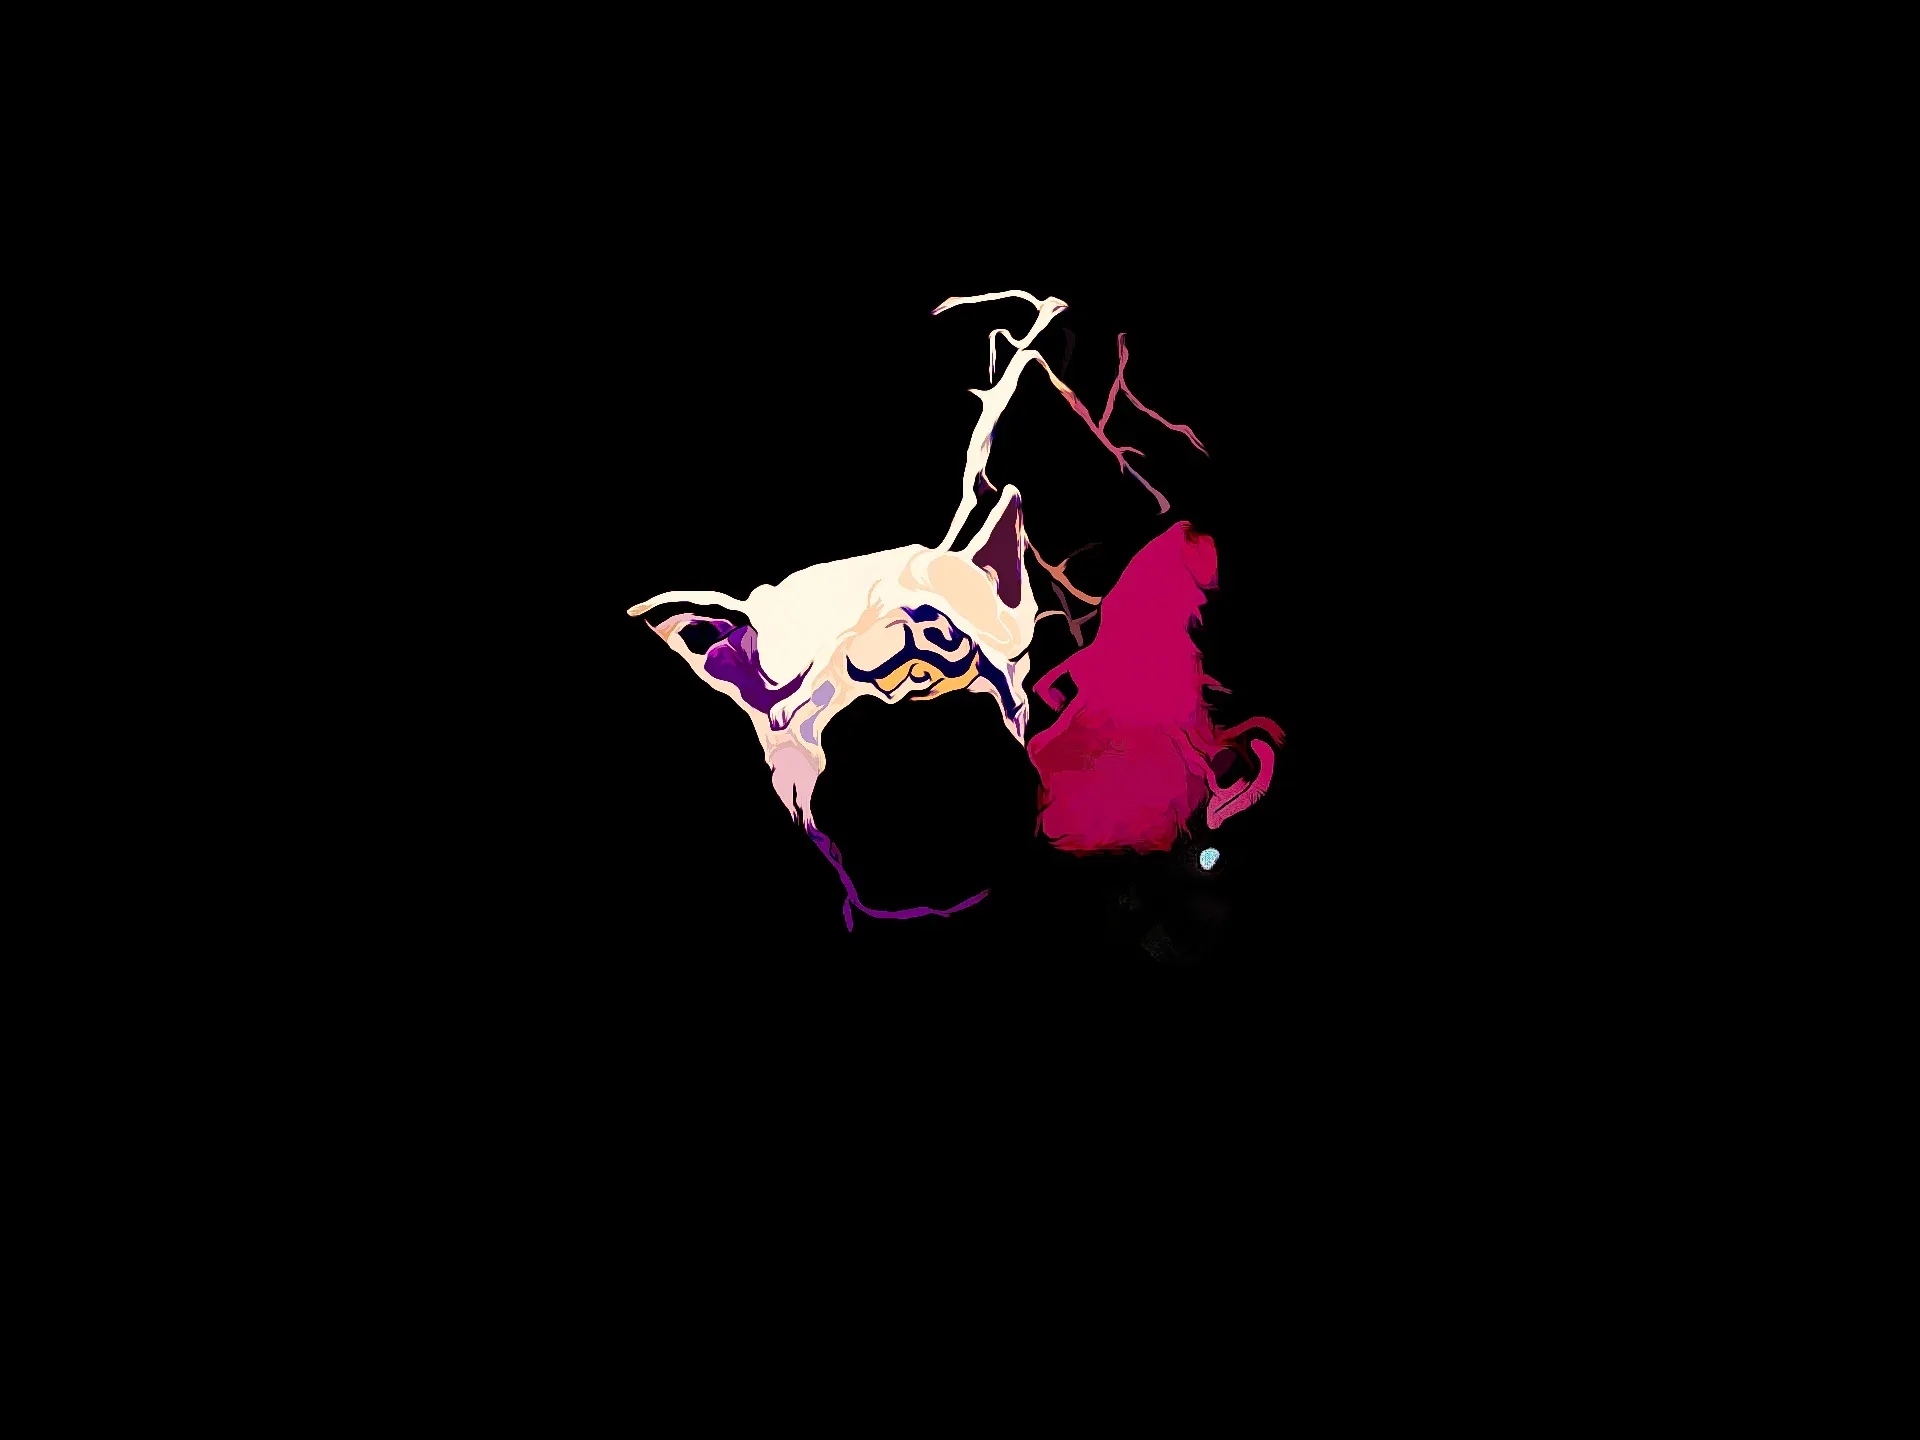
String label = dateTime + "POINTILLISATION OF BUTTERBJORK";

//Plotter dimensions
int xMin = 600;
int yMin = 800;
int xMax = 10300 - 300;
int yMax = 8400 - 600;
int A4_MAX_WIDTH = 10887;
int A4_MAX_HEIGHT = 8467;
int VERTICAL_CENTER = (xMax + xMin) /2;
int HORIZONTAL_CENTER = (yMax + yMin) /2;
int loops = 0;

int i = 0;
int lastY = yMin;
int cuttage = 355;

int x = 0;
int y = 0;
  int step = 5;
  int iteration = 6;

int xguide = x;
int yguide = y;

int mass = 50;

void setup() {
  size(840, 1080);
  smooth();


  img = loadImage("Bjork_EB.webp");
  //image(originalImage, 0, 0);
  //img =  get(300, 0, 900, 700);
  imageMode(CENTER);
  stroke(0, 0, 200, 90);
  background(255);
  frameRate(999999);
      fill(0, 0, 200, 90);


  if (just_draw) {
    draw_box = false;
    draw_label = false;
    PLOTTING_ENABLED = true;
  }

  //Select a serial port
  println(Serial.list()); //Print all serial ports to the console
  String portName = Serial.list()[1]; //make sure you pick the right one
  println("Plotting to port: " + portName);

  //Open the port
  myPort = new Serial(this, portName, 9600);
  myPort.bufferUntil(lf);

  //Associate with a plotter object
  plotter = new Plotter(myPort);

  //Initialize plotter
  if (PLOTTING_ENABLED) {
  plotter.write("IN;"); // add Select Pen (SP1) command here when the pen change mechanism is fixed

  //Draw a label first (this is pretty cool to watch)

  if (draw_label) {
  int labelX = xMax + 300;
  int labelY = yMin;
  plotter.write("PU"+labelX+","+labelY+";"); //Position pen
  plotter.write("SI0.14,0.14;DI0,1;LB" + label + char(3)); //Draw label
  fill(50);
  float textX = map(labelX, 0, A4_MAX_HEIGHT, 0, width);
  float textY = map(labelY, 0, A4_MAX_WIDTH, 0, height);

  text(dateTime + label, textY, textX);
  //Wait 0.5 second per character while printing label
  println("drawing label");
  delay(label.length() * 500);
  println("label done");
  }
    plotter.write("PU"+0+","+0+";", 3000); //Position pen

  }

}

void draw() {
  int delay = 150;
  int imageW = img.width;
  int imageH = img.height;
  y = (iteration+1)+int(random(1,4));
  x = x + step*int(random(1,3));
  color pix = img.get(x, y);
  float brightness = brightness(pix);
  if (brightness < 175) {
    if (brightness < 50) {
      step = round(random(2, 3));
        drawPoint(x, y, delay);
    } else if (x< 0.6*imageW && x> 0.3*imageH) {
      if (random(0,1) > 0.5) {
      fill(0, 0, 200, 90);
        drawPoint(x, y, delay);
      }
      step = round(random(3, 6));
    } else {
      step = int(random(5, 15));
      if (random(0,1) > 0.95) {
              fill(0, 0, 200, 90);
              drawPoint(x, y, delay);

      }
    }


  }

  if (x > imageW - cuttage) {
    x = 0;
    iteration = iteration + 1;
    int _x = int(map(x, 0, 1600 - cuttage, xMin, xMax));
    int _y = int(map(y, 0, 1000, yMin, yMax));
    plotter.write("PU"+_x+","+_y+";"); //Position pen
    delay(5000);
  }
      if (y > imageH) {
            x = 0;

    plotter.write("PU"+xMin+","+yMin+";"); //Position pen
    delay(5000);
    iteration = 0;
    loops = 1;
    println("LARGER THENA Y");
    fill(0, 200, 0, 90);
  }
}

void drawLine(float x1, float y1, float x2, float y2, boolean up) {
  float _x1 = map(x1, 0, A4_MAX_HEIGHT, 0, width);
  float _y1 = map(y1, 0, A4_MAX_WIDTH, 0, height);

  float _x2 = map(x2, 0, A4_MAX_HEIGHT, 0, width);
  float _y2 = map(y2, 0, A4_MAX_WIDTH, 0, height);
  line(_y1, _x1, _y2, _x2);

  String pen = "PD";
  if (up) {
    pen="PU";
  }


  if (PLOTTING_ENABLED) {

    plotter.write(pen+x1+","+y1+";");
    plotter.write("PD"+x2+","+y2+";"); //75 ms delay

    delay(200);
  }
}

void drawPoint(int x, int y, int delayT) {
  if (loops < 1) {


  x = int(map(x, 0, 1600 - cuttage, xMin, xMax));
  y = int(map(y, 0, 1000, yMin, yMax));

  float _x = map(x, 0, A4_MAX_HEIGHT, 0, width);
  float _y = map(y, 0, A4_MAX_WIDTH, 0, height);


  point(_y, _x);
  ellipse(_y, _x, 1.5, 1.5);
  if (PLOTTING_ENABLED) {
    plotter.write("PU"+x+","+y+";"); //Position pen
    plotter.write("PD"+x+","+y+";"); //Position pen

    delay(delayT);
  }
  }
}


/*************************
 Simple plotter class
 *************************/

class Plotter {
  Serial port;

  Plotter(Serial _port) {
    port = _port;
  }

  void write(String hpgl) {
    if (PLOTTING_ENABLED) {
      port.write(hpgl);
    }
  }

  void write(String hpgl, int del) {
    if (PLOTTING_ENABLED) {
      port.write(hpgl);
      delay(del);
    }
  }
}

Worms 3 Armageddon Rick and Morty soundpack

What is this?

Worms 3 Armageddon allows you to replace voice lines and sound effects. This is a Rick and Morty soundpack I made way back in 2015. The voice lines were ripped with great care from episodes of the show, and from the DOTA2 announcer pack. All worms are Mortys, and all announcements are from Rick and Morty.

Installation

  1. Download the soundpack from here.
  2. Extract the files to your Worms 3 Armageddon installation directory.
  3. Launch the game and enjoy the new sounds!